Foreword from the UK Foreign, Commonwealth and Development Office (FCDO)
We are at an exciting moment for scaling fintech in Africa. Using widely-accessible, low-cost, digital solutions, many fintech companies are putting the power of financial services directly into the hands of SMEs and hundreds of millions of individuals, previously underserved by traditional banking systems. Families can now manage savings and cash-flow requirements from the palm of a hand, and informal workers can digitise their payments records and establish a credit history. Fintech underpins how many of the business models we are seeing today scale across sectors such as energy and agriculture. Digital financial inclusion can help drive economic growth, foster investment, and ultimately help reduce poverty.
At FCDO, we constantly seek to understand the drivers of success so that we can align our work and investment to achieve maximum impact. The research behind this report stemmed from the question “Why do some digital initiatives scale, while many do not?” The report is a first step in adopting a more data-centric approach to the challenges of scale and seeking evidence of consistency in the factors that link to scale. It is a complex issue and we know that there is no simple answer but, by working with the Wheeler Institute for Business and Development, we believe this work contributes to the sector-wide understanding of these complexities as we strive to unlock the power of fintech and digital solutions more broadly.
Magdalena Banasiak
Head of Technology and Innovation – Scaling and Partnerships
UK Foreign, Commonwealth and Development Office (FCDO)
Executive summary
The importance of scale prevalence in African fintech
In the context of African fintech, defining scale itself is the first step to understanding causal factors of scale. Company scale is often deemed a yardstick of success by operators, investors and policymakers, but defining scale in the context of digital technologies across Africa is challenging, given the heterogeneity across markets, sector sub-segments and fintech business models. Anecdotal case studies are helpful in understanding how individual companies have scaled but offer little information to make comparisons across the overall landscape. Despite extensive academic research exploring product take-off and technology diffusion, there is little formal quantitative research investigating the prevalence of scale, especially in the context of digital technologies in Africa.
A new way of measuring scale
Our research approach demonstrates that it is possible to use large sample sizes and a quantitative approach to analyse scale prevalence in African fintech. The research team analysed 716 companies across four metrics related to company-level scale: number of end-users; annual revenue (in USD$); cumulative funds raised (in USD$); and number of employees. After various iterations of our methodology and a series of interviews with leading industry experts, the research team was able to analyse scale prevalence across African geographies, fintech sector sub-segments, and time periods.
Scale prevalence across African fintech
Of the 716 companies operating across the continent, only 37 fintech companies, or 5% of the sample, achieved scale. Our analysis showed the following:
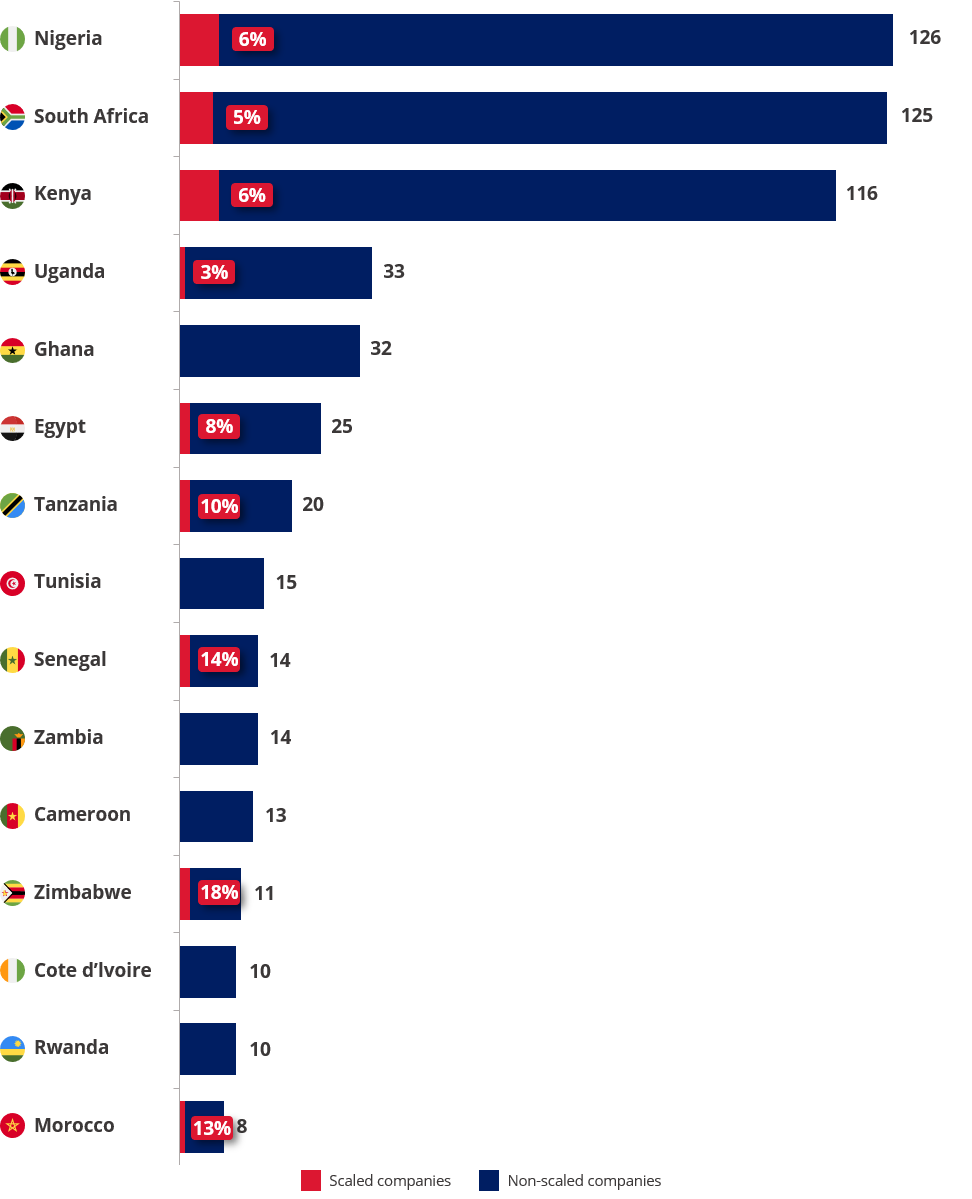
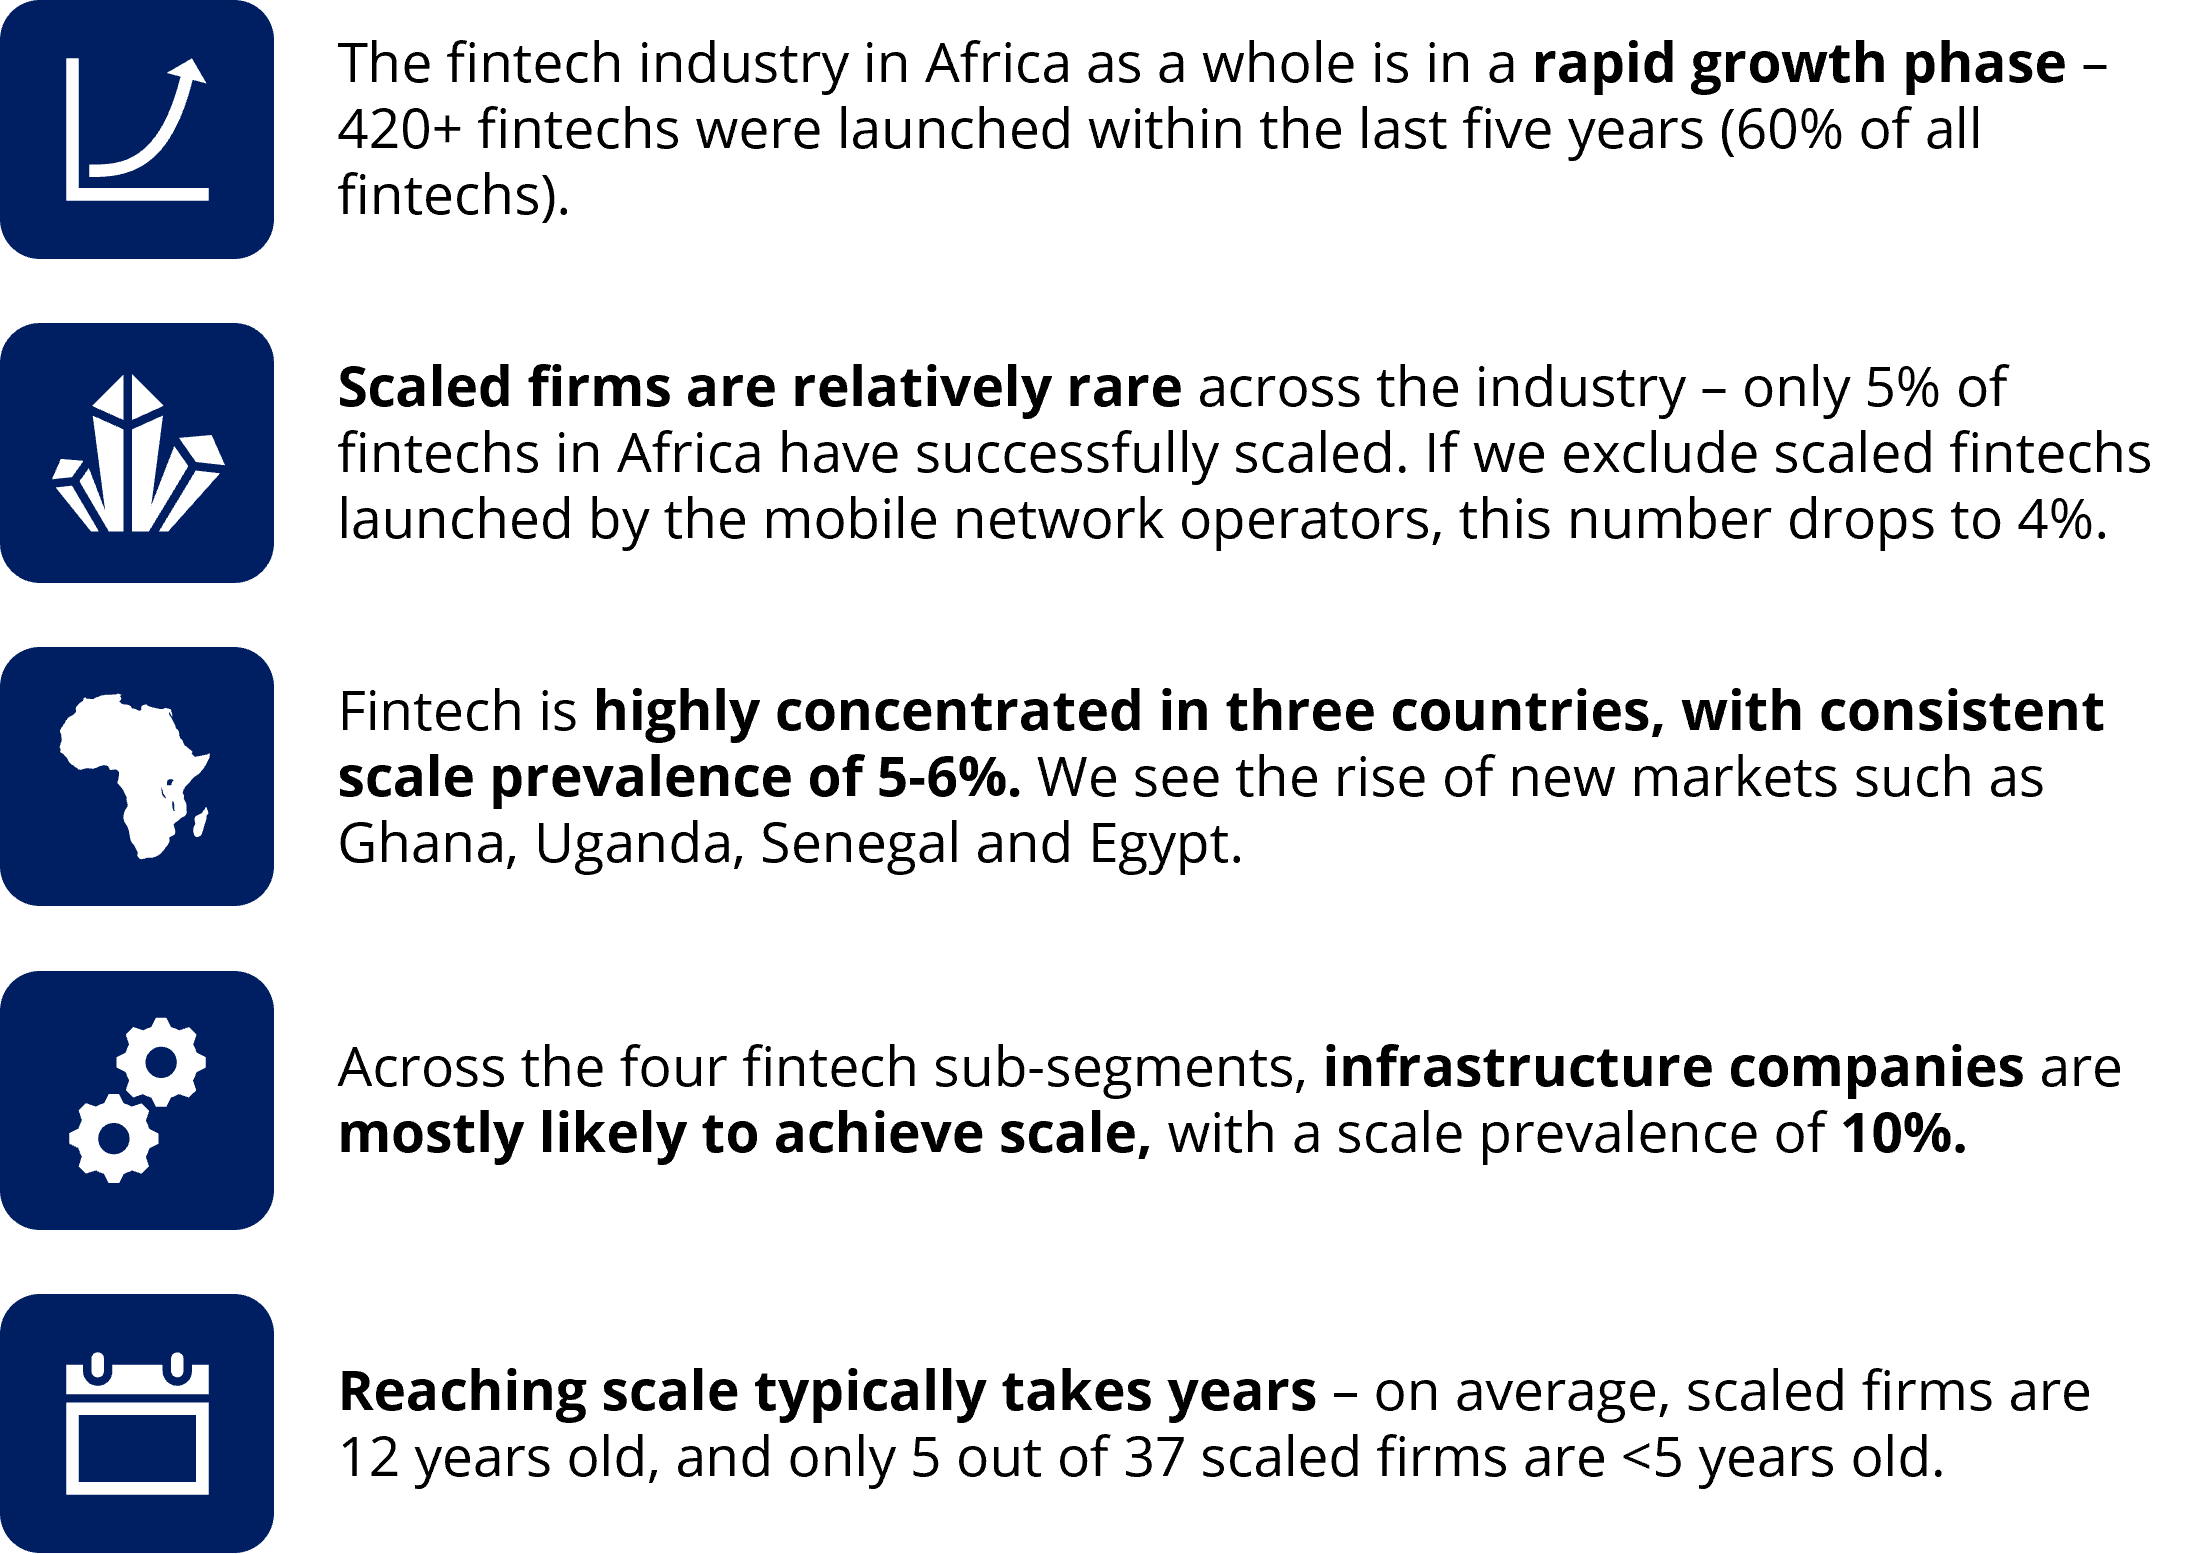
- Fintech is concentrated among Africa’s three fintech powers – South Africa, Nigeria and Kenya: 51% of fintech companies and 54% of all scaled fintechs are based in these three country markets. Scale prevalence is consistent at 5-6% within these country markets.
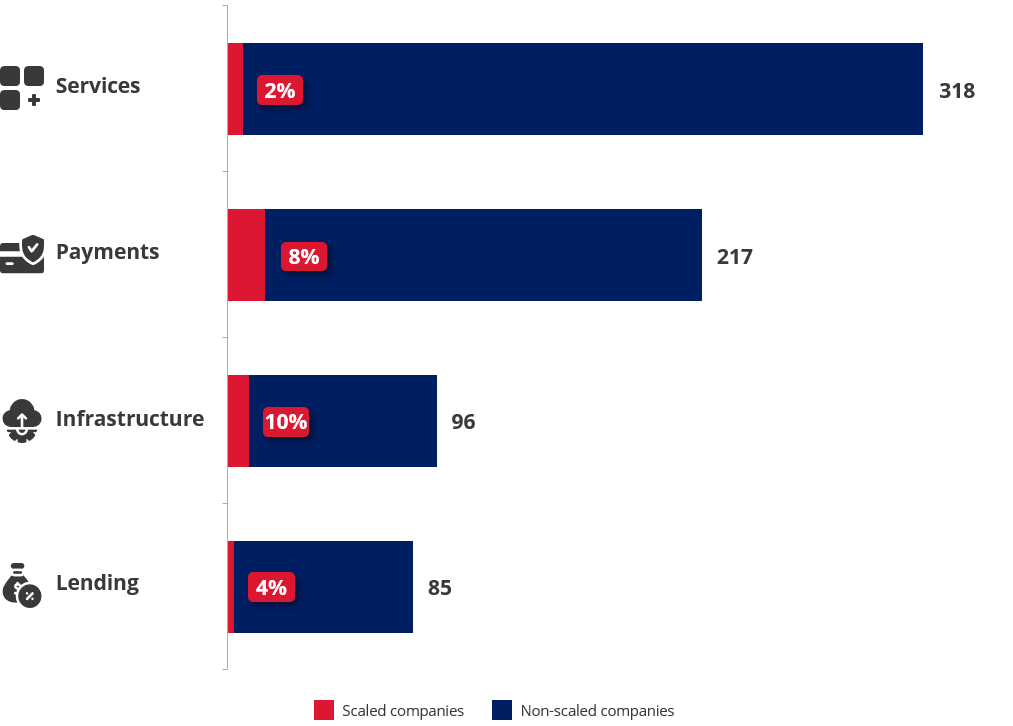
- Infrastructure sector has the highest prevalence of scale: 10% relative to 2-8% in other sectors
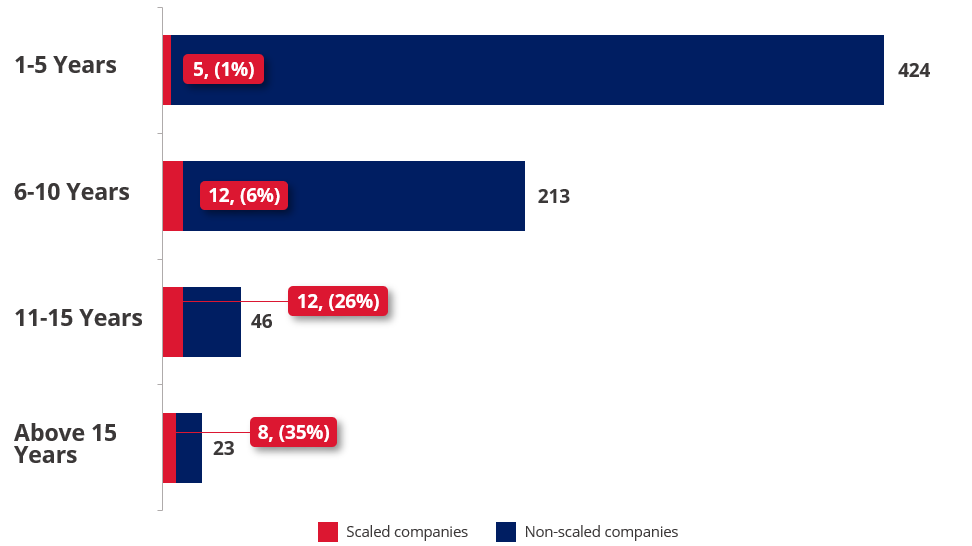
- Scaled fintechs are on average 12 years old – only 5 scaled fintechs were founded within the last 5 years, so achieving scale takes time.
The report clarifies our definition of scale and fintech in an African context, and so paves the way for some practical insights for key industry stakeholders, investors, business leaders and policymakers.
What comes next?
Understanding scale prevalence lays the groundwork for a robust, quantitative approach to understanding the causes of scale. Our Phase 2 work will examine the factors that encourage or inhibit scale among fintechs in Africa.
Introduction
Africa’s fintech industry has great scale potential
The past decade has seen rapid growth in the fintech ecosystem in Africa. In 2019, more than 700 fintech companies were operating in the region, and over $1 billion in venture capital funding had been invested in the start-up ecosystem. Many larger players, especially the mobile network operators, have invested significant capital in growing their digital financial services businesses. The region is also seeing the emergence of so-called digital challenger banks (such as Tyme Bank).
Key factors that make this sector a sweet spot for fintech companies include a huge mobile customer base and a large number of small informal businesses increasingly transitioning to digital ecosystems to meet customer demands for financial services. Digital solutions, supported by improved GSM and Wi-Fi network coverage, and more affordable smartphones are enabling the stakeholders to leapfrog traditional infrastructure to lighter-touch, lower-cost, and more efficient regimes. These market forces clearly point toward the rapid growth of the sector.
One might therefore assume there would be many fintech companies operating at scale.
Challenges in implementation persist
The journey to these sunlit digital uplands is not straightforward. The practicalities of implementation are complex. Fragmentation pervades Africa’s many different legislative jurisdictions and cultures. The only consistency is difference: Africa is not one playing field.
There may seem to be large addressable markets, but there are also relatively low and highly skewed disposable incomes. Scaling a business that serves lower-income tiers is notoriously hard. At the other end of the spectrum, it is hard to discern where multiple companies with similar offerings are chasing relatively small customer segments which have high disposable incomes.
Major research gaps
There is much academic and empirical evidence on innovation, product take-off, and technology diffusion, but very little on where the context is set by (a) digital initiatives and (b) emerging economies. This absence of knowledge, especially with respect to data-based insights, led to this project being scoped with our co-sponsors, UK Foreign Commonwealth & Development Office (FCDO).
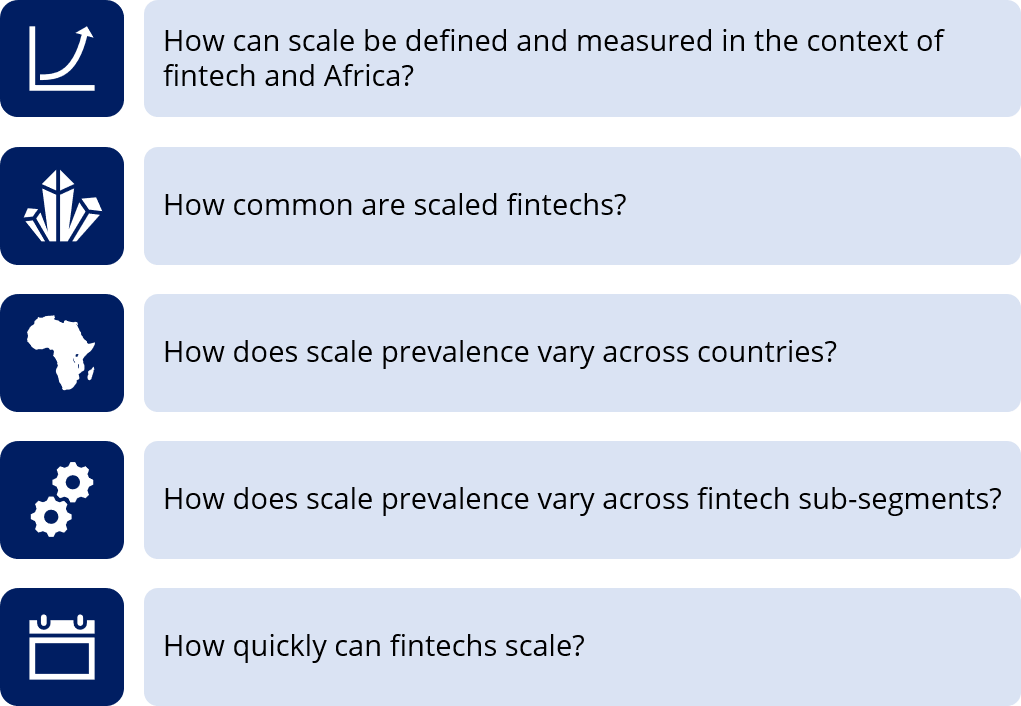
There is little debate that digital financial services have high potential to reach millions of people currently excluded from, or almost invisible to service providers. In this context, 'reaching scale' is often used as the go-to goal by investors, policymakers and service providers. But what does scale mean in a fintech context? How many fintech companies have scaled in Africa? What can investors, business leaders, and policymakers do to increase the likelihood of scale? These are the hard, but important questions that need to be answered. As the first in a series of insight papers on the topic, the research team will tackle these issues by defining scale and examining how many firms have scaled in Africa.
Our research questions
A new way of measuring scale
Defining and measuring scale
In order to approach the challenging task of defining and measuring scale with the requisite robustness, the research study used a multi-step, mixed-methods approach combining a quantitatively based scale index with expert interviews.
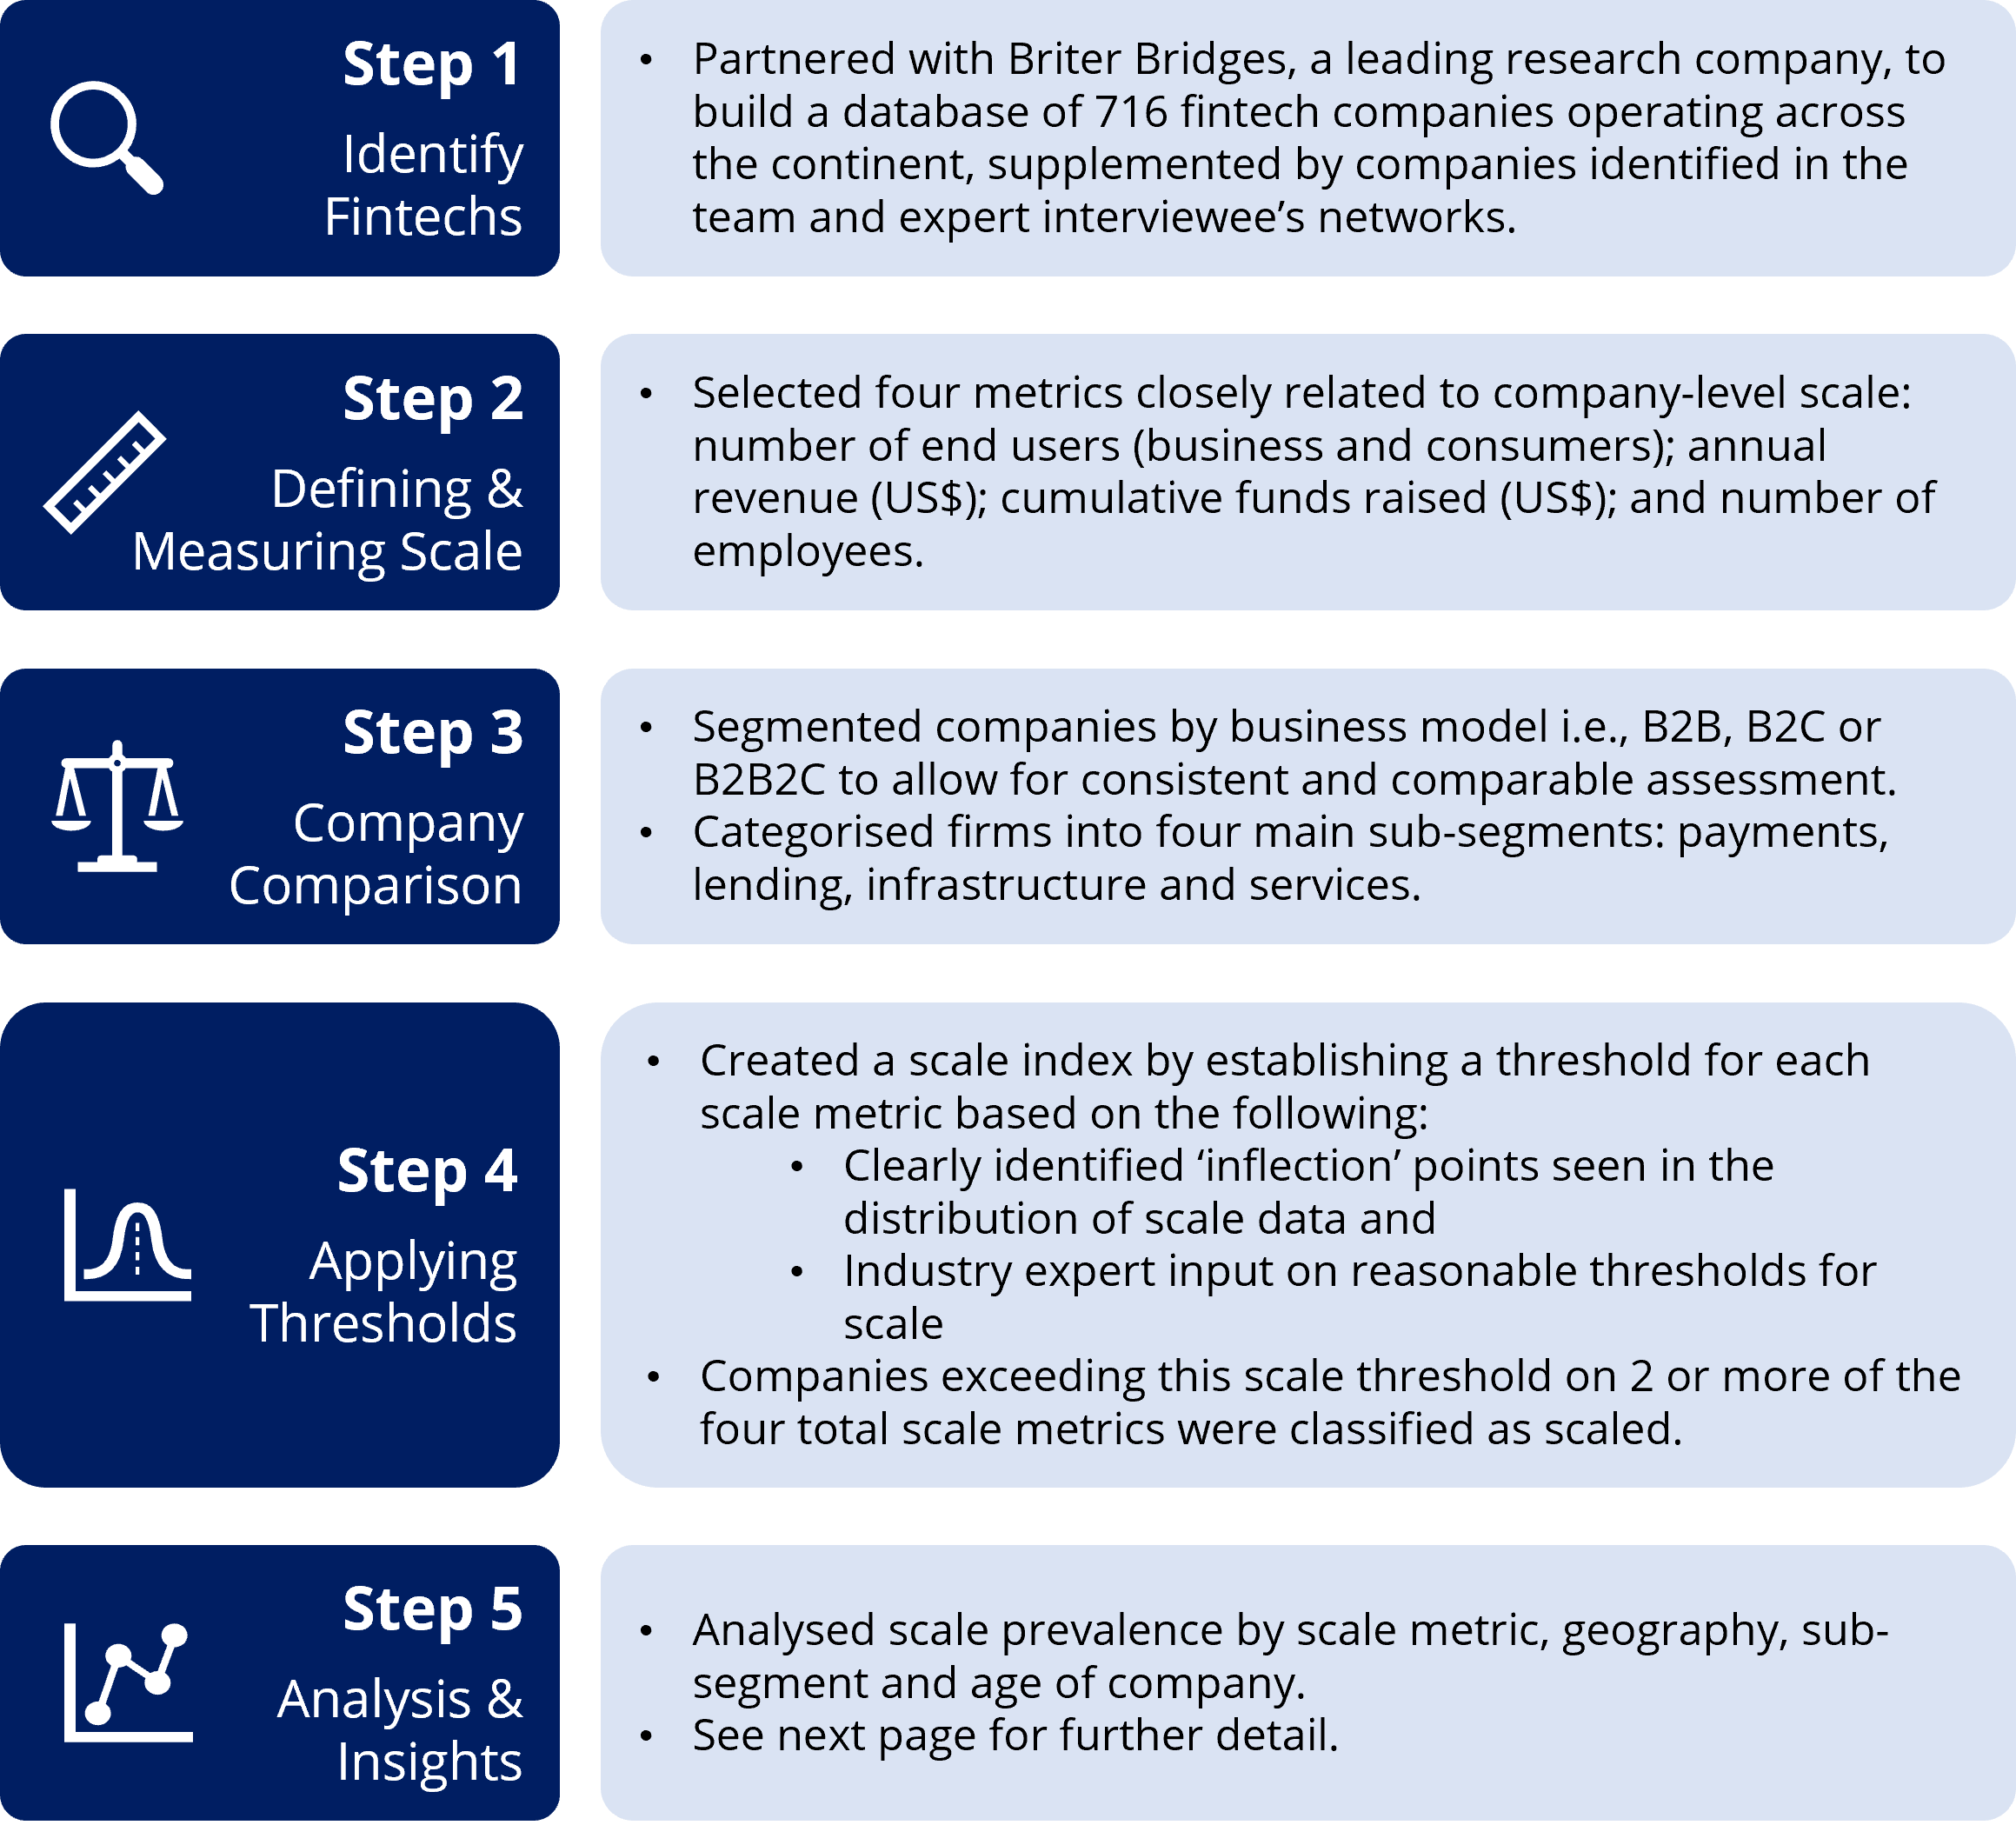
Analysing prevalence of scale
The first phase of our research focuses on quantifying the prevalence of scale.
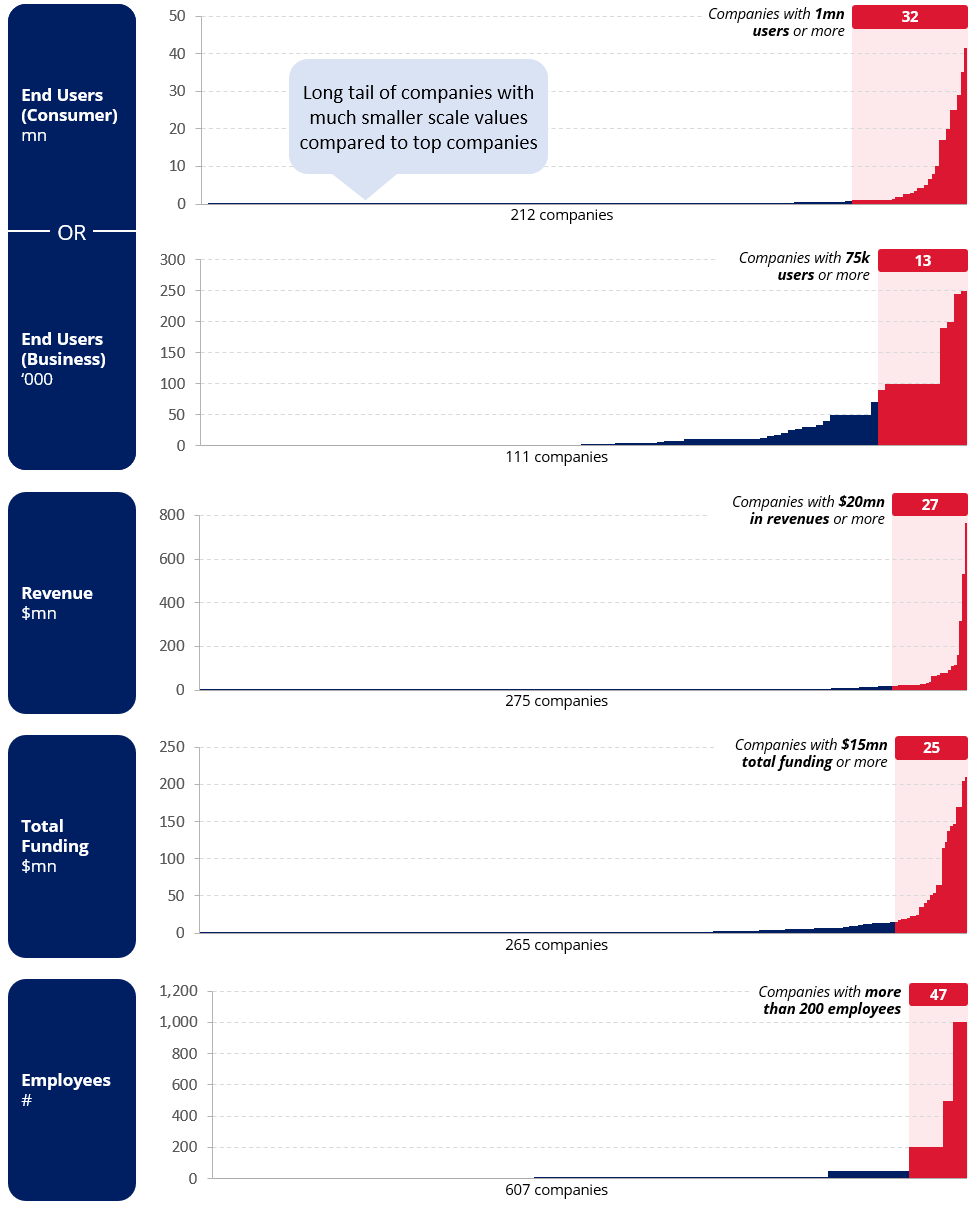
Scale factor distribution
Companies that exceeded the scale threshold based on our methodology received one 'scale point'. A company needs a minimum of two scale points to be considered a scaled fintech. Employee data is the most complete with 607 out of 716 companies with available data.
Scale prevalence in African fintech
Scale prevalence snapshot
Out of the 716 fintech companies that operate in Africa, only 37, or 5%, have reached scaled based on our definition. More than half of the scaled companies come from the African tech powers Nigeria, South Africa, and Kenya.
Top 8 African countries by number of fintech companies1
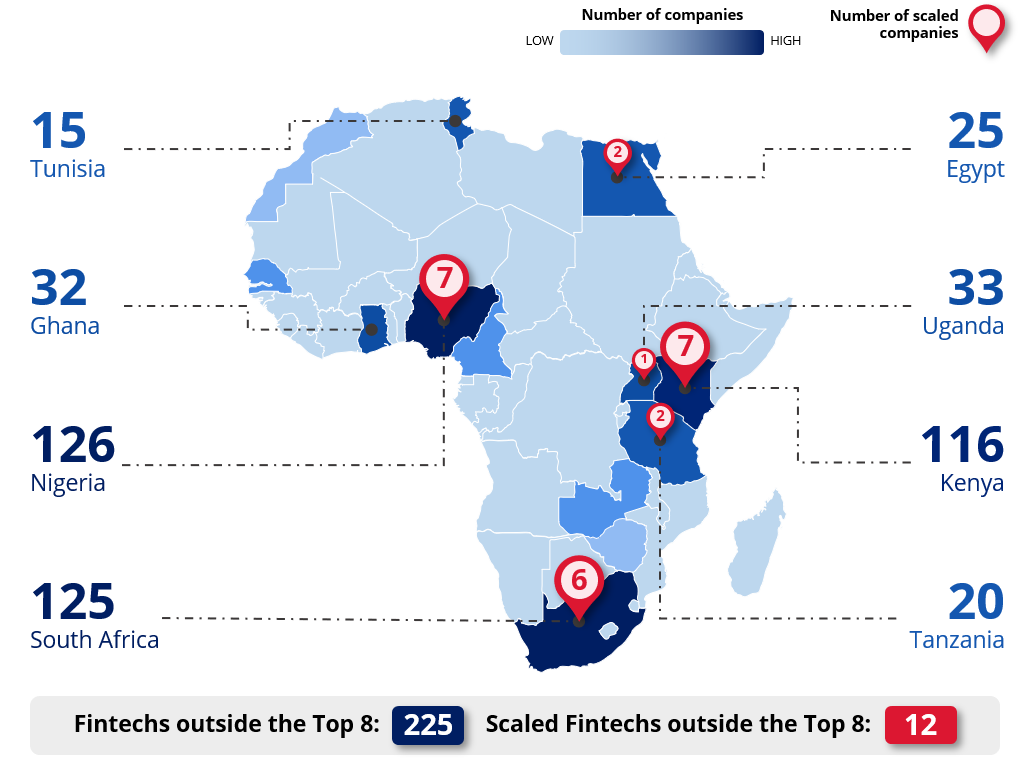
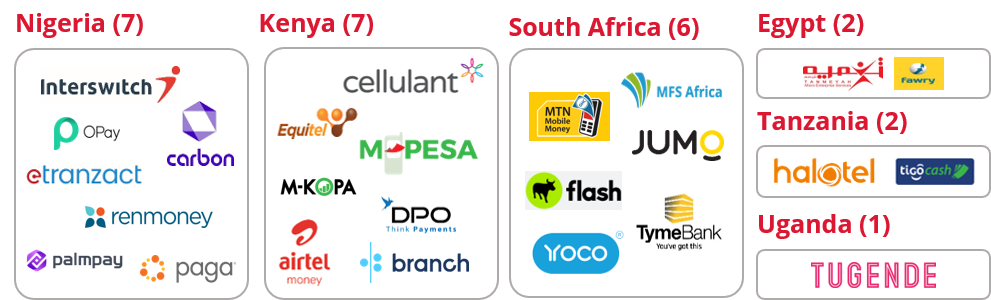
Scaled companies across the top 8 countries
Scale prevalence across countries
Scale prevalence across the top 3 African countries (Nigeria, South Africa, and Kenya) is consistent between 5-6%. Some countries with fewer fintechs have a higher prevalence of scale.
Scale prevalence across the top 15 African countries
Scale prevalence across industry sub-segments
Turning to our breakdown by sub-segment, we can see higher scale prevalence in Infrastructure and Payments, at 10% and 8% respectively.
Scale prevalence across 4 sub-segments
Scale prevalence across age
The last five years have seen a boom in the growth of the number of companies, with more than 50% of operating companies being younger than 5 years old. However, the majority of scaled companies are much older, with 32 out of 37 scaled companies being more than 5 years old.
Distribution of fintech companies by age1
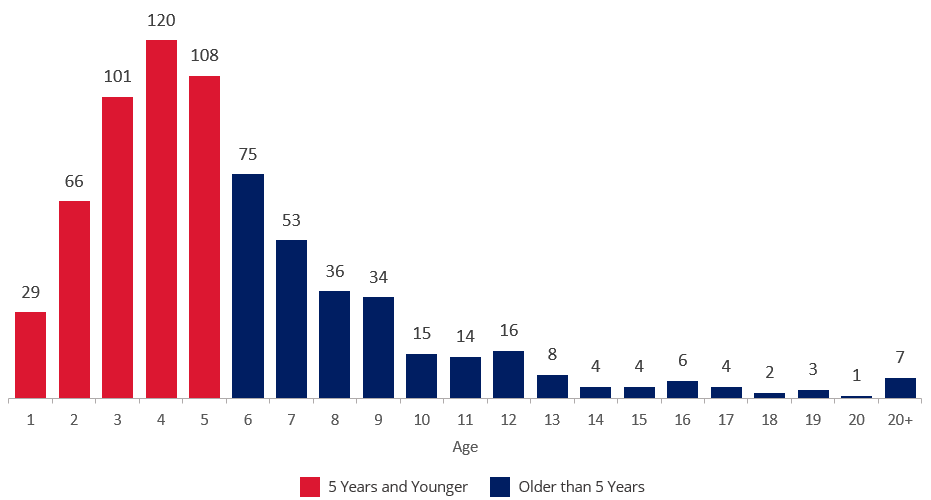
Scale prevalence across age groups
1 Graph shows a total of 706 companies. 10 companies have unverified founding year information.
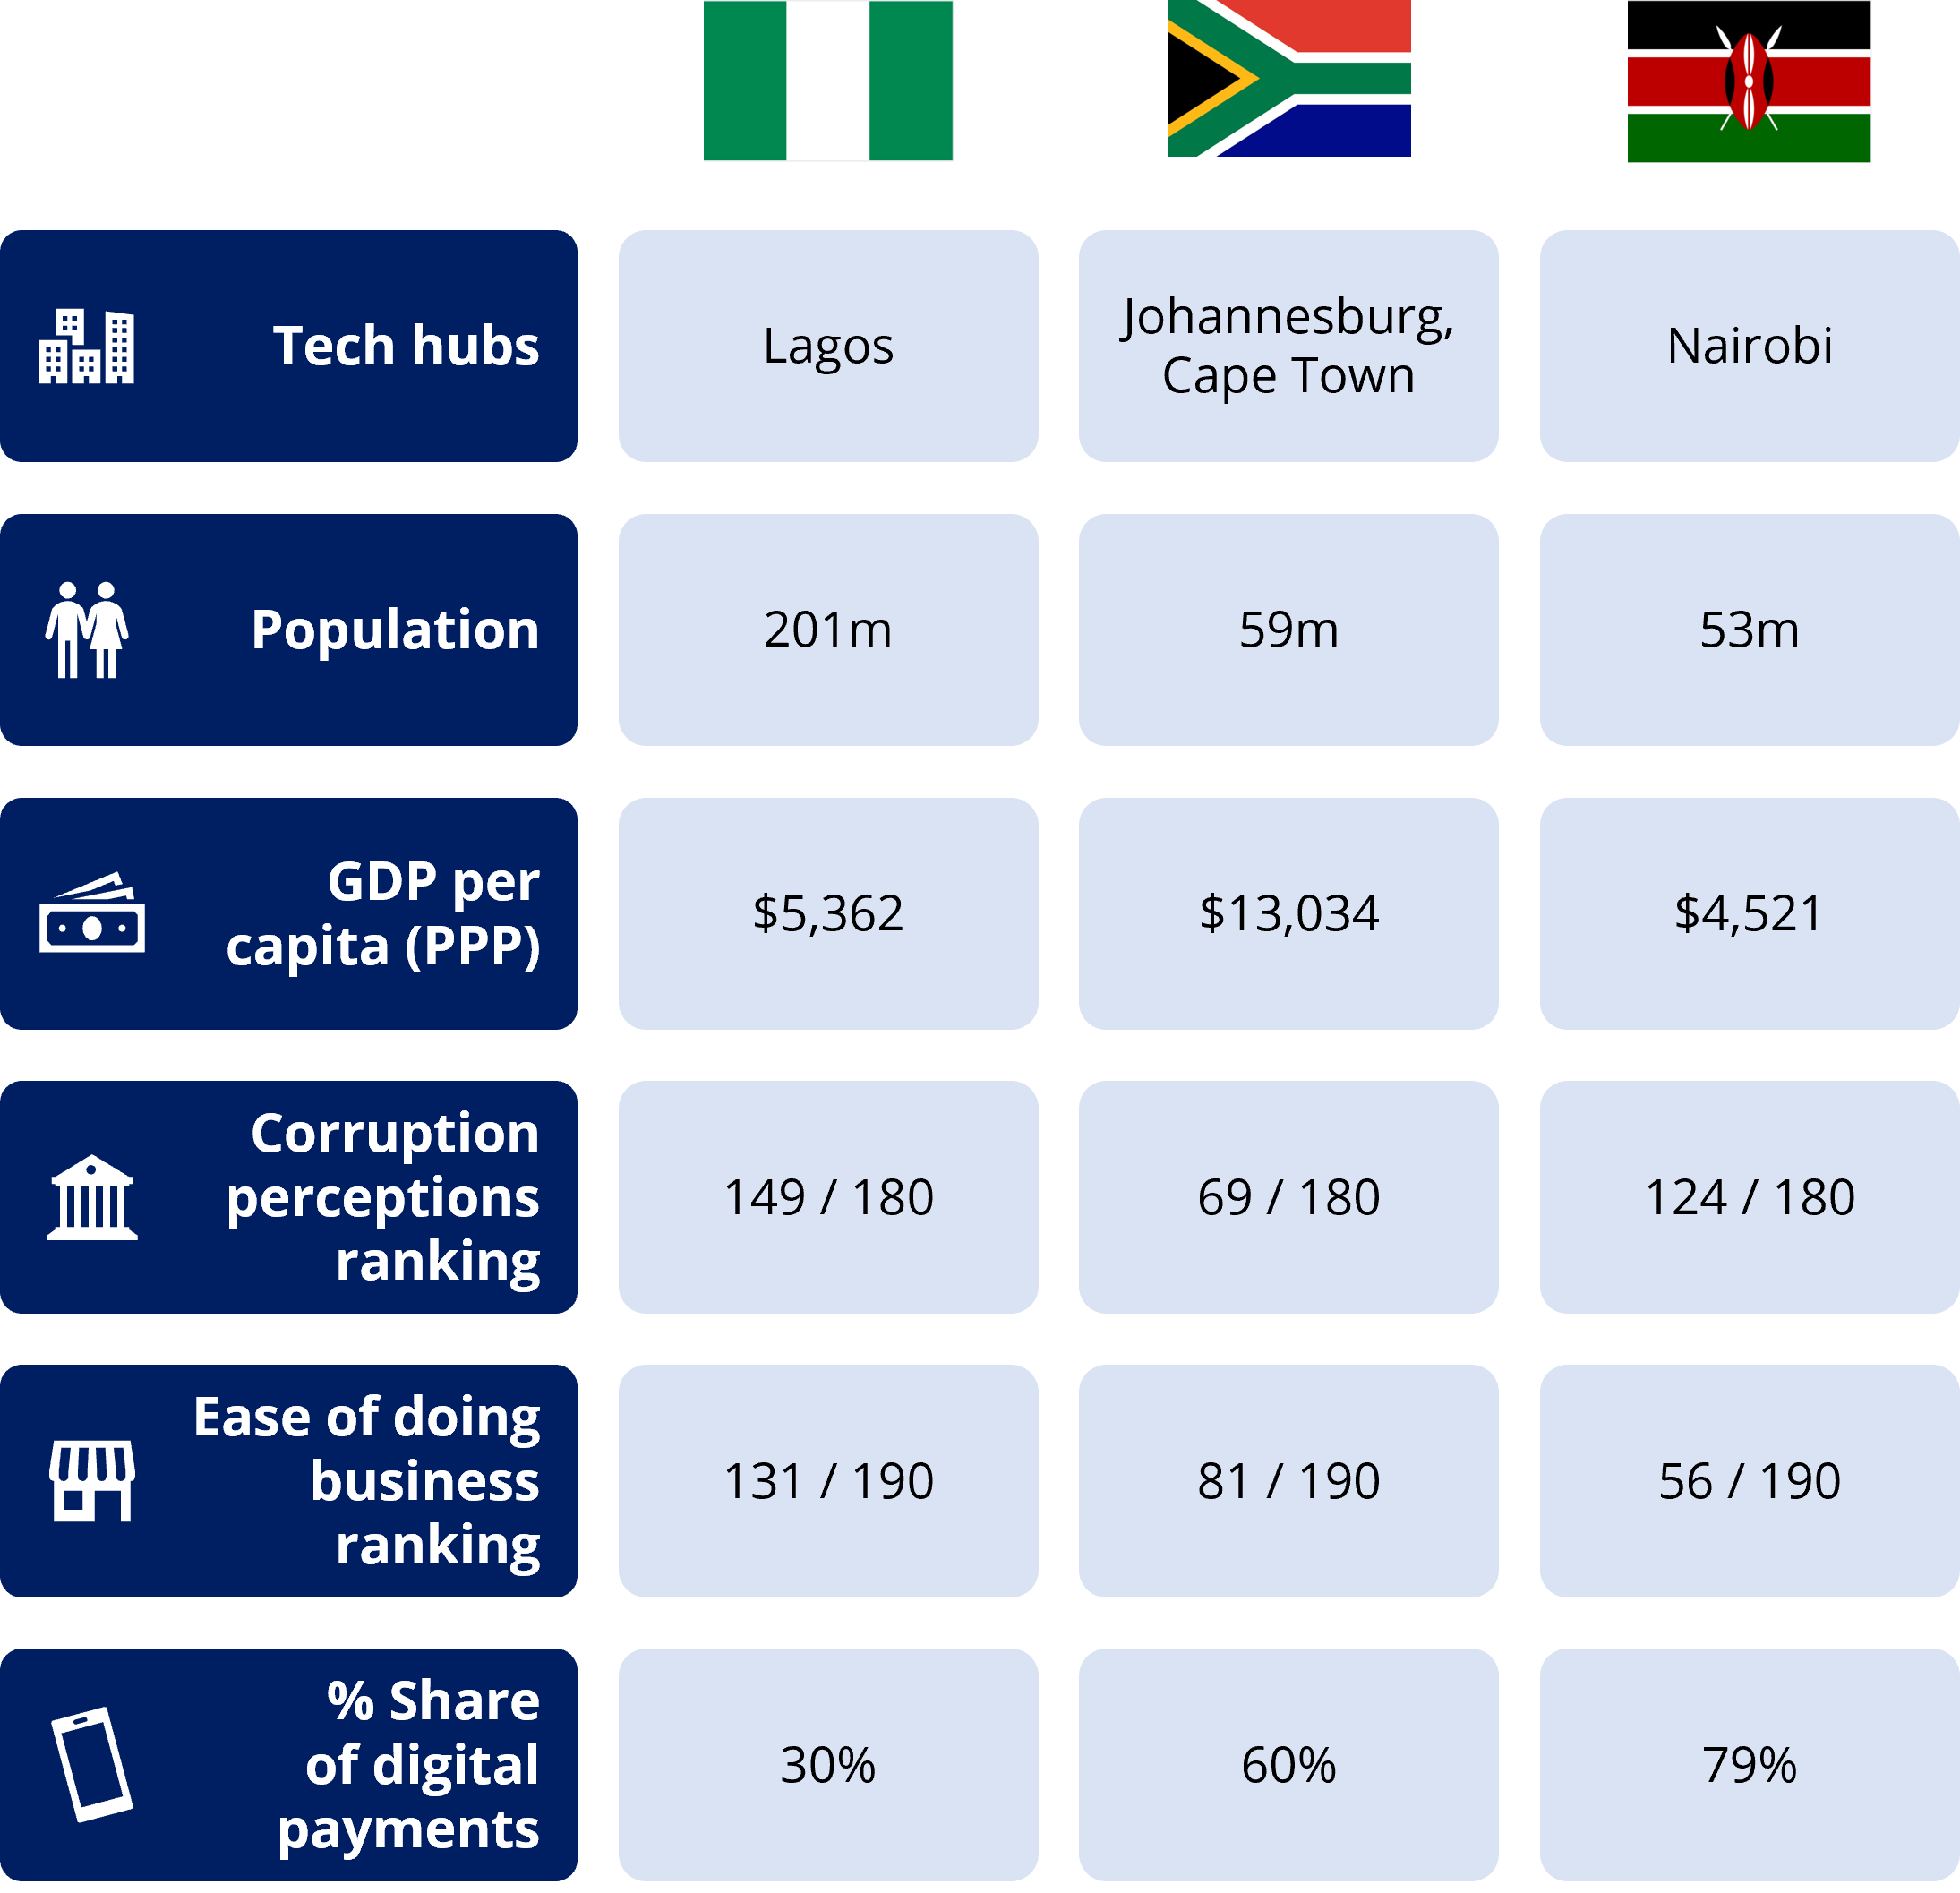
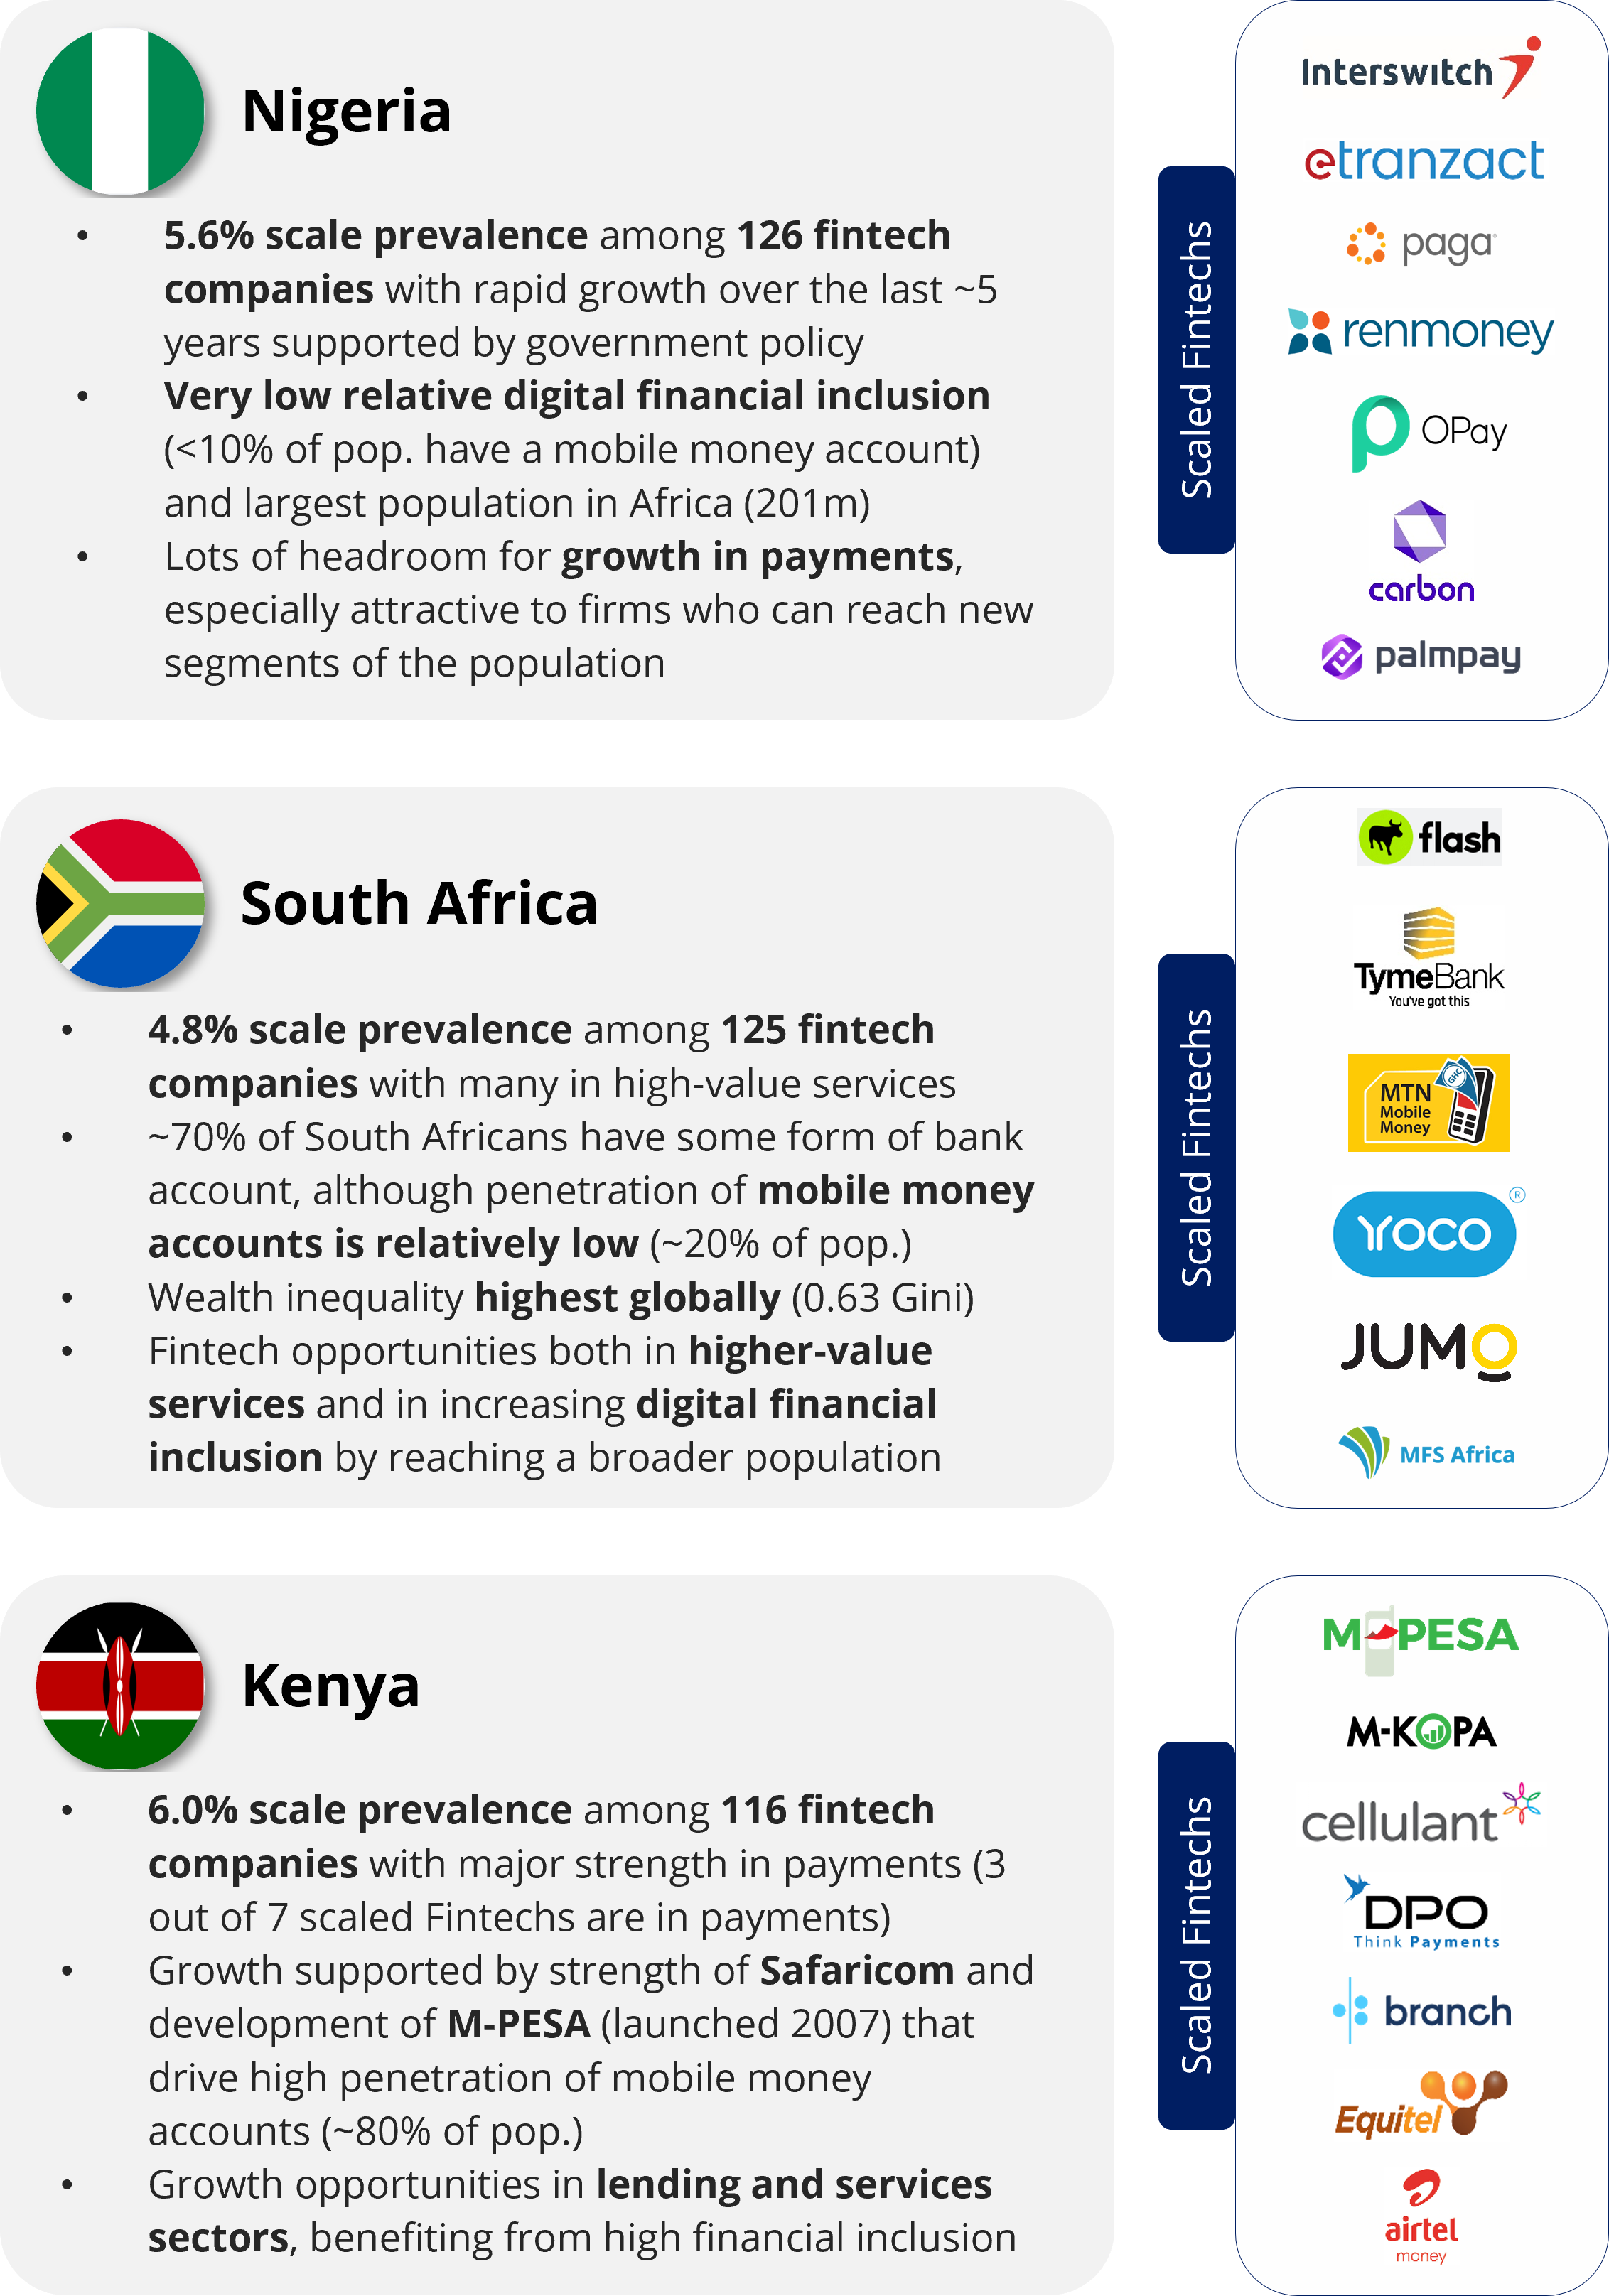
Africa's fintech powers
Fintech market-mapping
Our analysis shows the heterogeneity of the fintech industry across countries in Africa. In order to identify key characteristics and market trends, we took simple proxies for three important market variables – fintech ecosystem activity, digital financial inclusion, and size of economy.
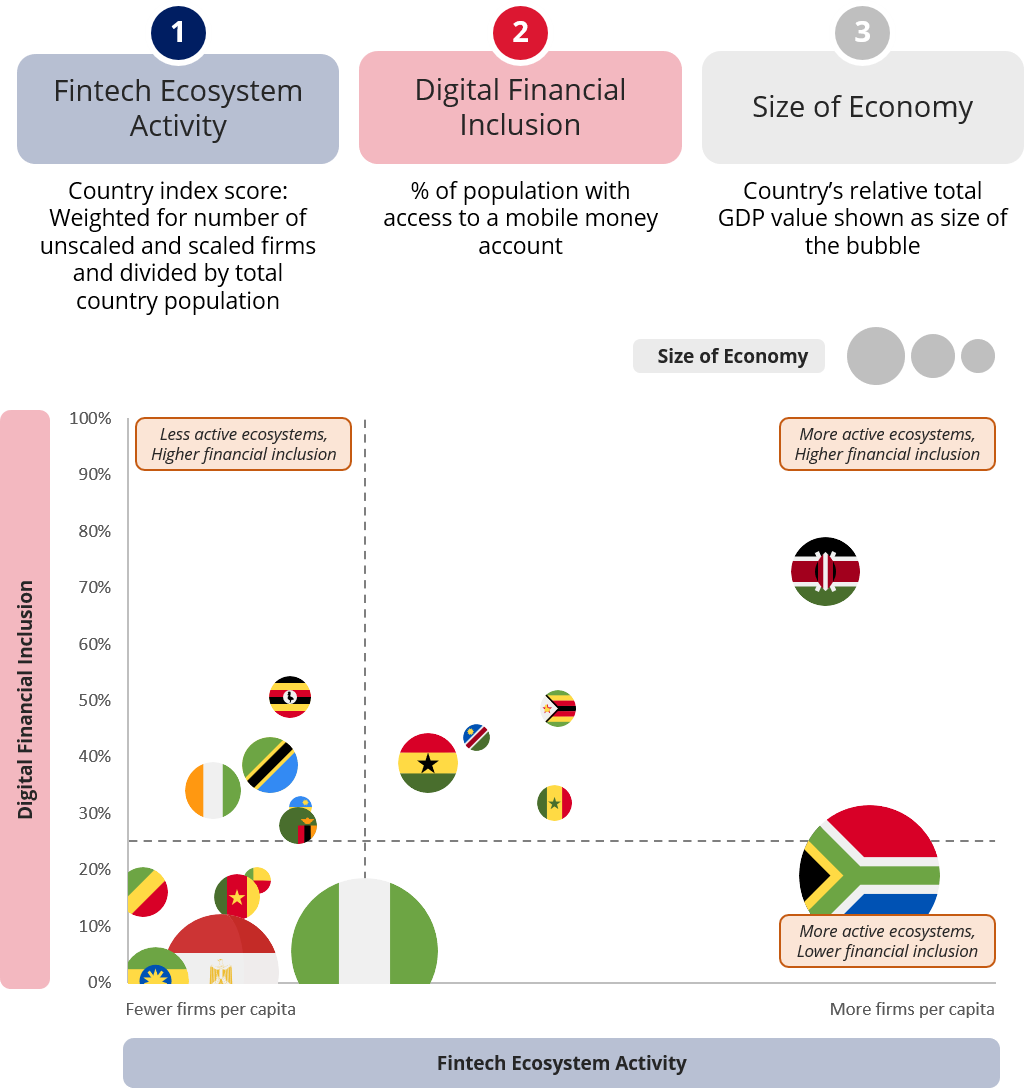
Africa's three fintech powers
51% of all of Africa’s fintechs, and 54% (20 out of 37) of Africa’s scaled fintechs are headquartered in just three countries; Nigeria, South Africa, and Kenya.
We took a deep-dive look at these…
Conclusion
Key takeaways
The goal of this research is to bring clarity to this exciting, fast-moving sector, and to understand what fintech and scale mean in an African context by investigating the data. A better understanding of this can help inform decisions at both a policy and practice level.
Our research shows that it is possible to use a robust, quantitative, large sample size when undertaking research to understand the complexity behind scale. It is important to acknowledge that defining and measuring scale is not a simple task – the research team had to navigate challenges to come up with a robust, defendable definition of what we mean by scale and, indeed, how we segment the fintech industry into sub-segments, to establish a better understanding of what drives scale.
From our research we can infer five high-level findings:
Preview of future research
The objective of this first report is to show the number of fintech companies that have scaled in Africa. This is important because understanding what constitutes scale is a prerequisite to unpacking what drives it. We have shown how it is possible to unpack fintech into sub-segments and apply a data-based approach to indexing company size. This allows us to deal with the complexity that characterises the category of fintech. Already, as captured here, we can see new types of fintech providers such as M-KOPA and Tugende who are financing connected assets by exploiting two factors: connectivity and prevalence of digital payments. Looking forward, we are likely to see increasing numbers of specialist digital financial service providers embedding into supply chains for example, or being created to serve specific value-chains tied to operators in sectors well beyond the traditional Financial Institutions (for example in goods distribution or FMCG).
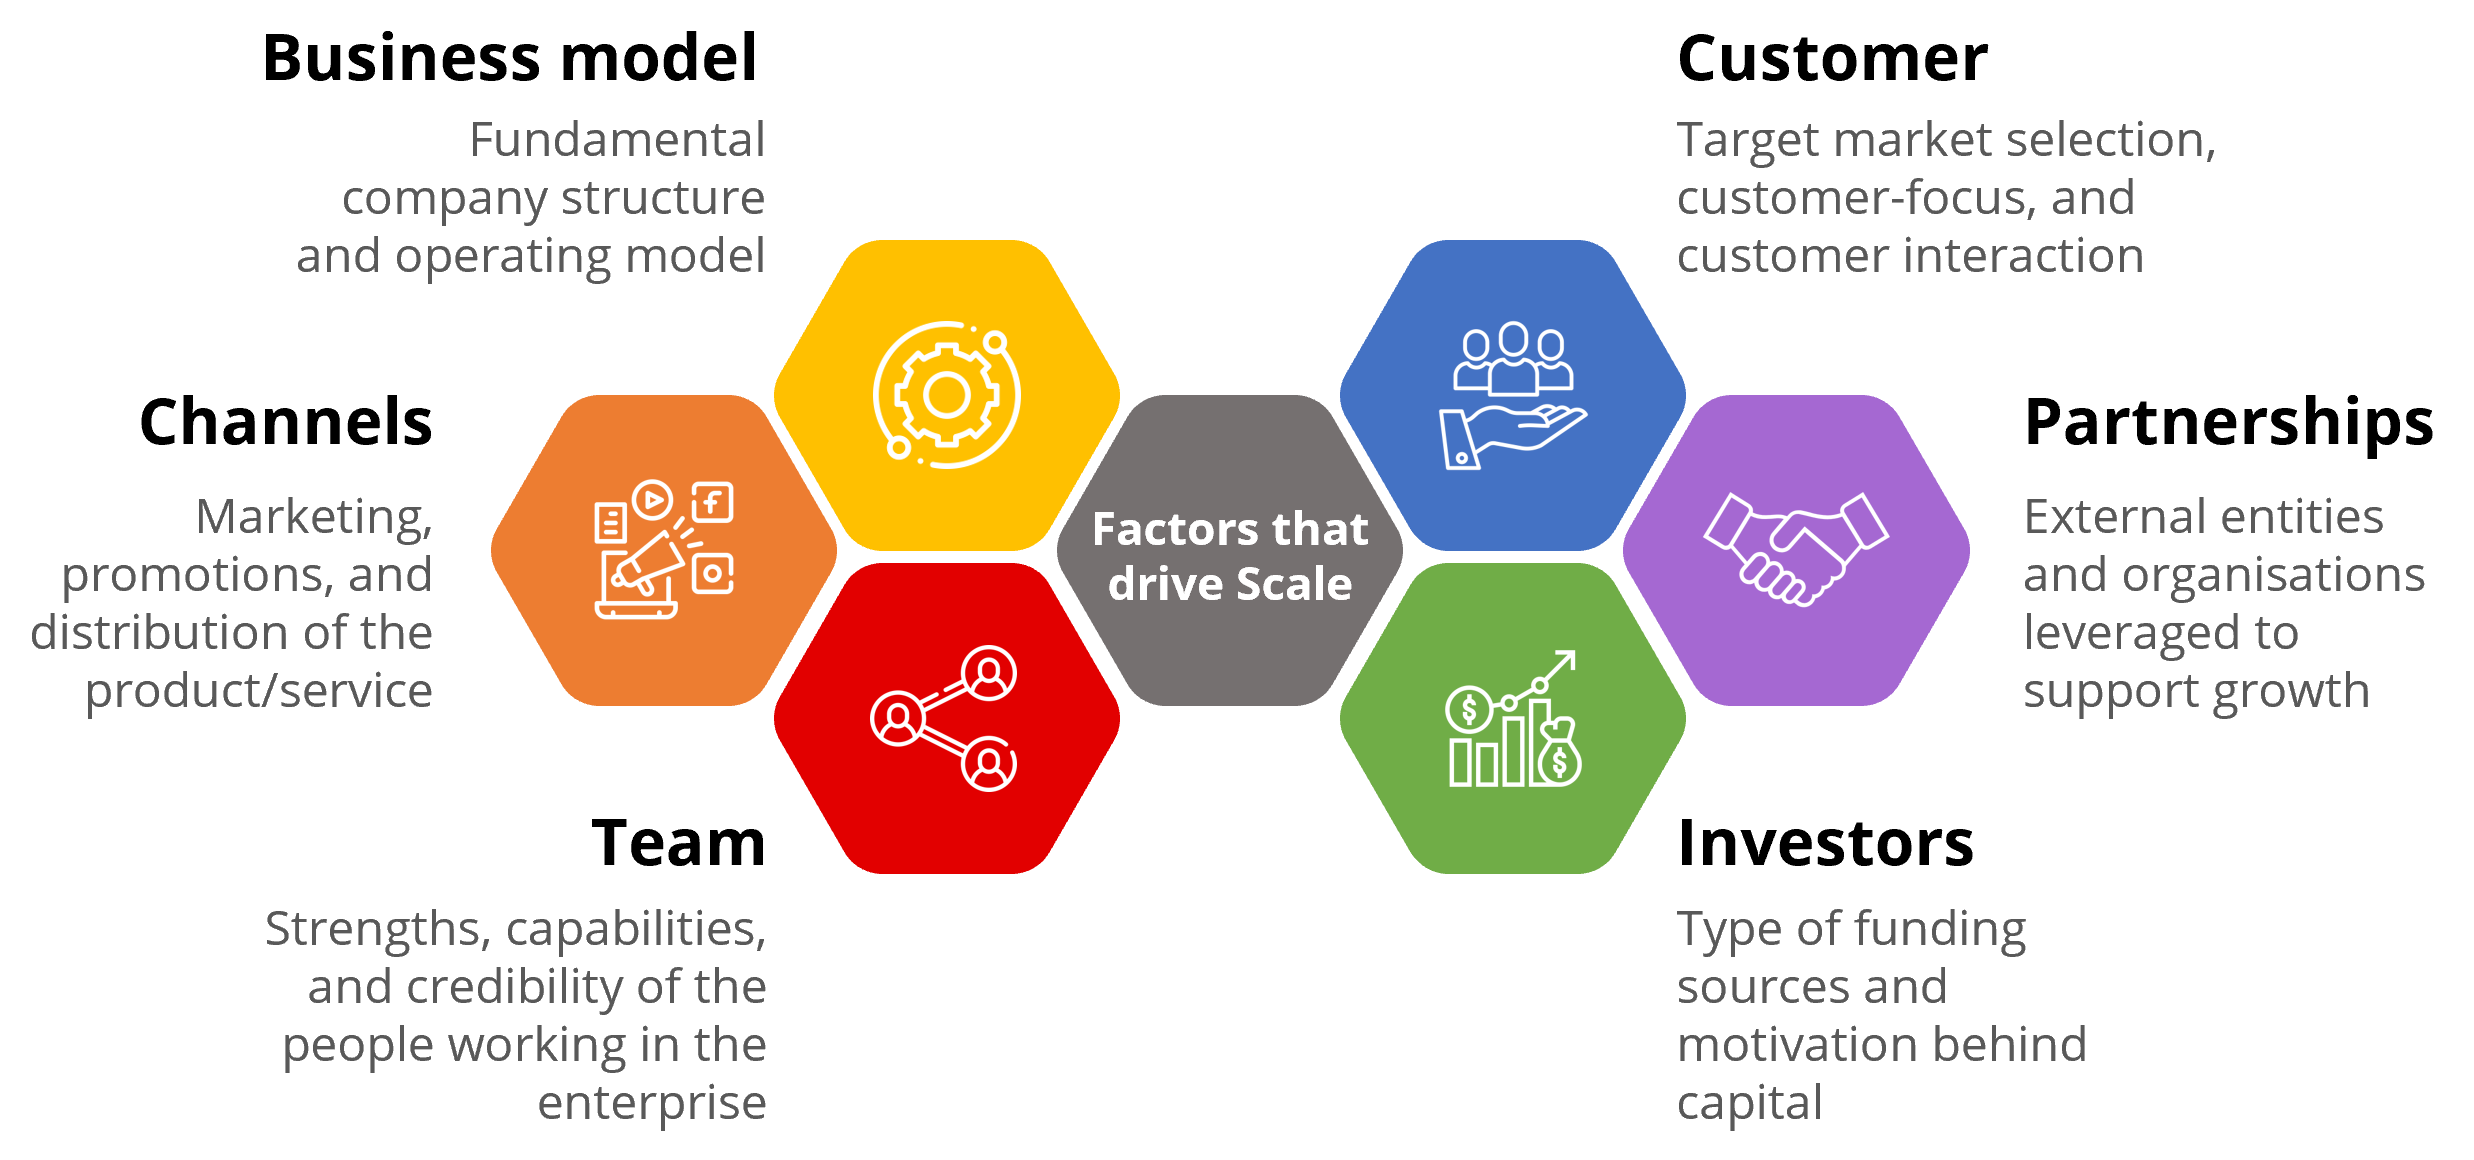
In subsequent research, we will examine the scaled companies in more depth to identify consistency in the factors that might influence scale.
Our methodology for this subsequent stage is to seek answers to some 50+ questions that relate to business models, channel/ product offerings, team composition and experience, investors, partnerships, and target customers. Below, we preview some of the themes around the questions that our team has researched to understand and test the factors behind scale in companies.
Definitions and glossary
Company database sample
The companies in the report are sourced from Briter Bridges Intelligence
Platform, the GSMA’s Mobile Money State of the Industry Report, and expert recommendations across the Wheeler Institute for Business and Development’s network. The following are additional rules used to construct the database:
- Exclude companies with global operations and with only a small proportion of total operations in Africa (e.g., a core banking system software supplier with customers around the globe, some of which are in Africa);
- Exclude companies that do not rely on digital technology as a core part of their value proposition or operational model (e.g., a mainstream bank with a mobile app);
- Include companies that have fintech subsidiaries, for example, payments companies of telecom service providers (e.g., Orange Money and M-PESA Africa);
- Exclude online ‘marketplaces’; and
- Exclude purely donor-funded initiatives, thereby focusing on commercial, revenue-generating entities.
Fintech definition
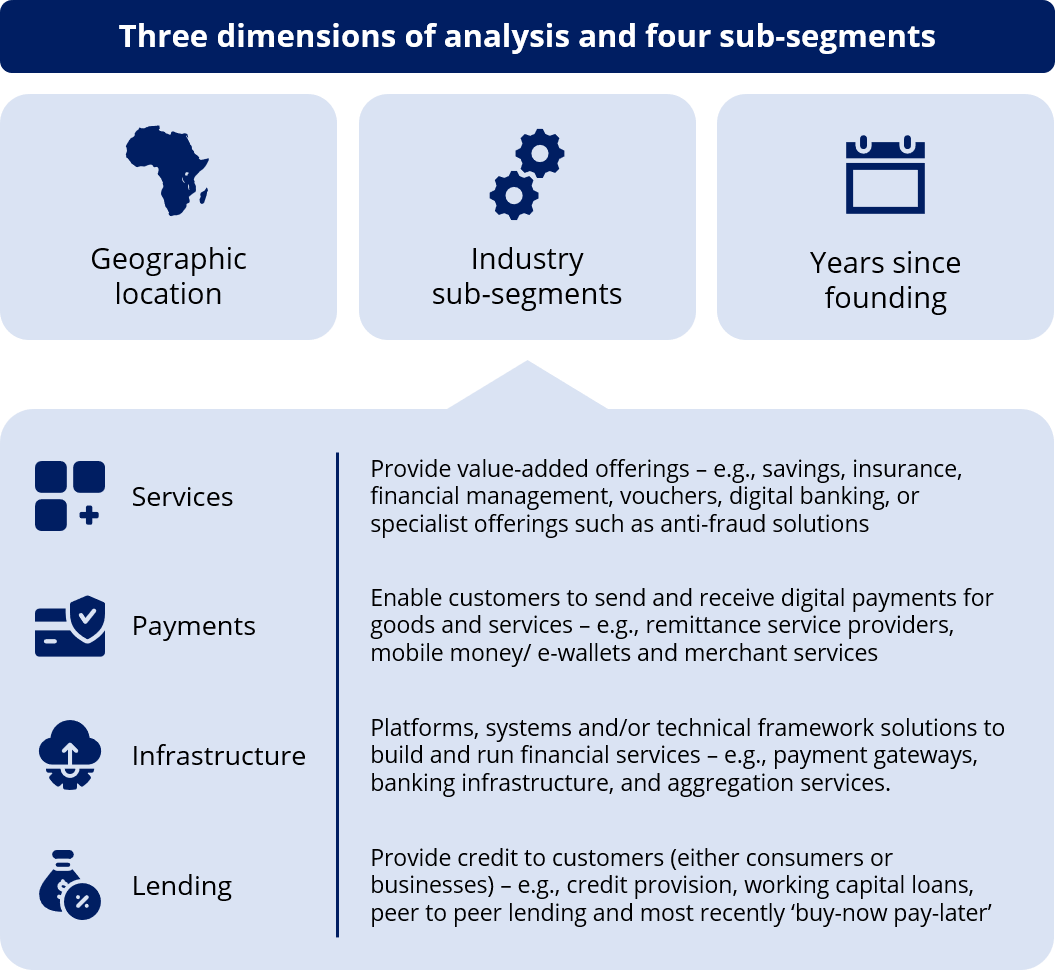
Fintech is a very broad church and there are multiple definitions in use today. In the context of this report, a fintech company is defined as a business that provides technology for financial services or a financial services company that uses digital technology as its primary means of delivering its products and services. In order to be included, digital technology must be central to the company’s operations and value proposition; without it, the company would not be able to deliver the service or product. According to the Briter Bridges platform, there are 89 sub-segments within fintech. Based on our knowledge and research, we grouped these into four categories: payments, lending, infrastructure, and services.
Industry sub-segment classifications
Fintech is not one thing. While infrastructure and services are both bundled into fintech, the companies in these segments operate in significantly different ways. Here we describe four sub-categories that we believe are representative and allow us to undertake a more rigorous, judicious analysis. Even this simple sub-segmentation is not easy because some companies span multiple categories. Where this has occurred, the team has made an informed categorisation based on our knowledge of the respective company and sector.
Infrastructure
Infrastructure companies provide platforms, systems, and/or technical framework solutions to build and run financial services. Companies in this category are often not end-consumer facing; solutions include payment gateways, banking infrastructure, lending infrastructure, and aggregation services (including API management).
Payments
Payments companies allow customers and merchants to send and receive digital payments for goods and services. Companies in this sector include mobile money/ e-wallets, merchant services, and remittance service providers.
Lending
Lending companies provide credit to customers (either consumers or businesses). Companies in this category include credit provision, micro-credit, working-capital loans, peer-to-peer lending facilitation, and most recently, the emergence of ‘buy-now-pay-later’ solutions.
Services
Services companies provide value-added services such as savings, insurance, financial management, vouchers, digital banking, or specialist services such as anti-fraud solutions.